
Walkthrough User Guide
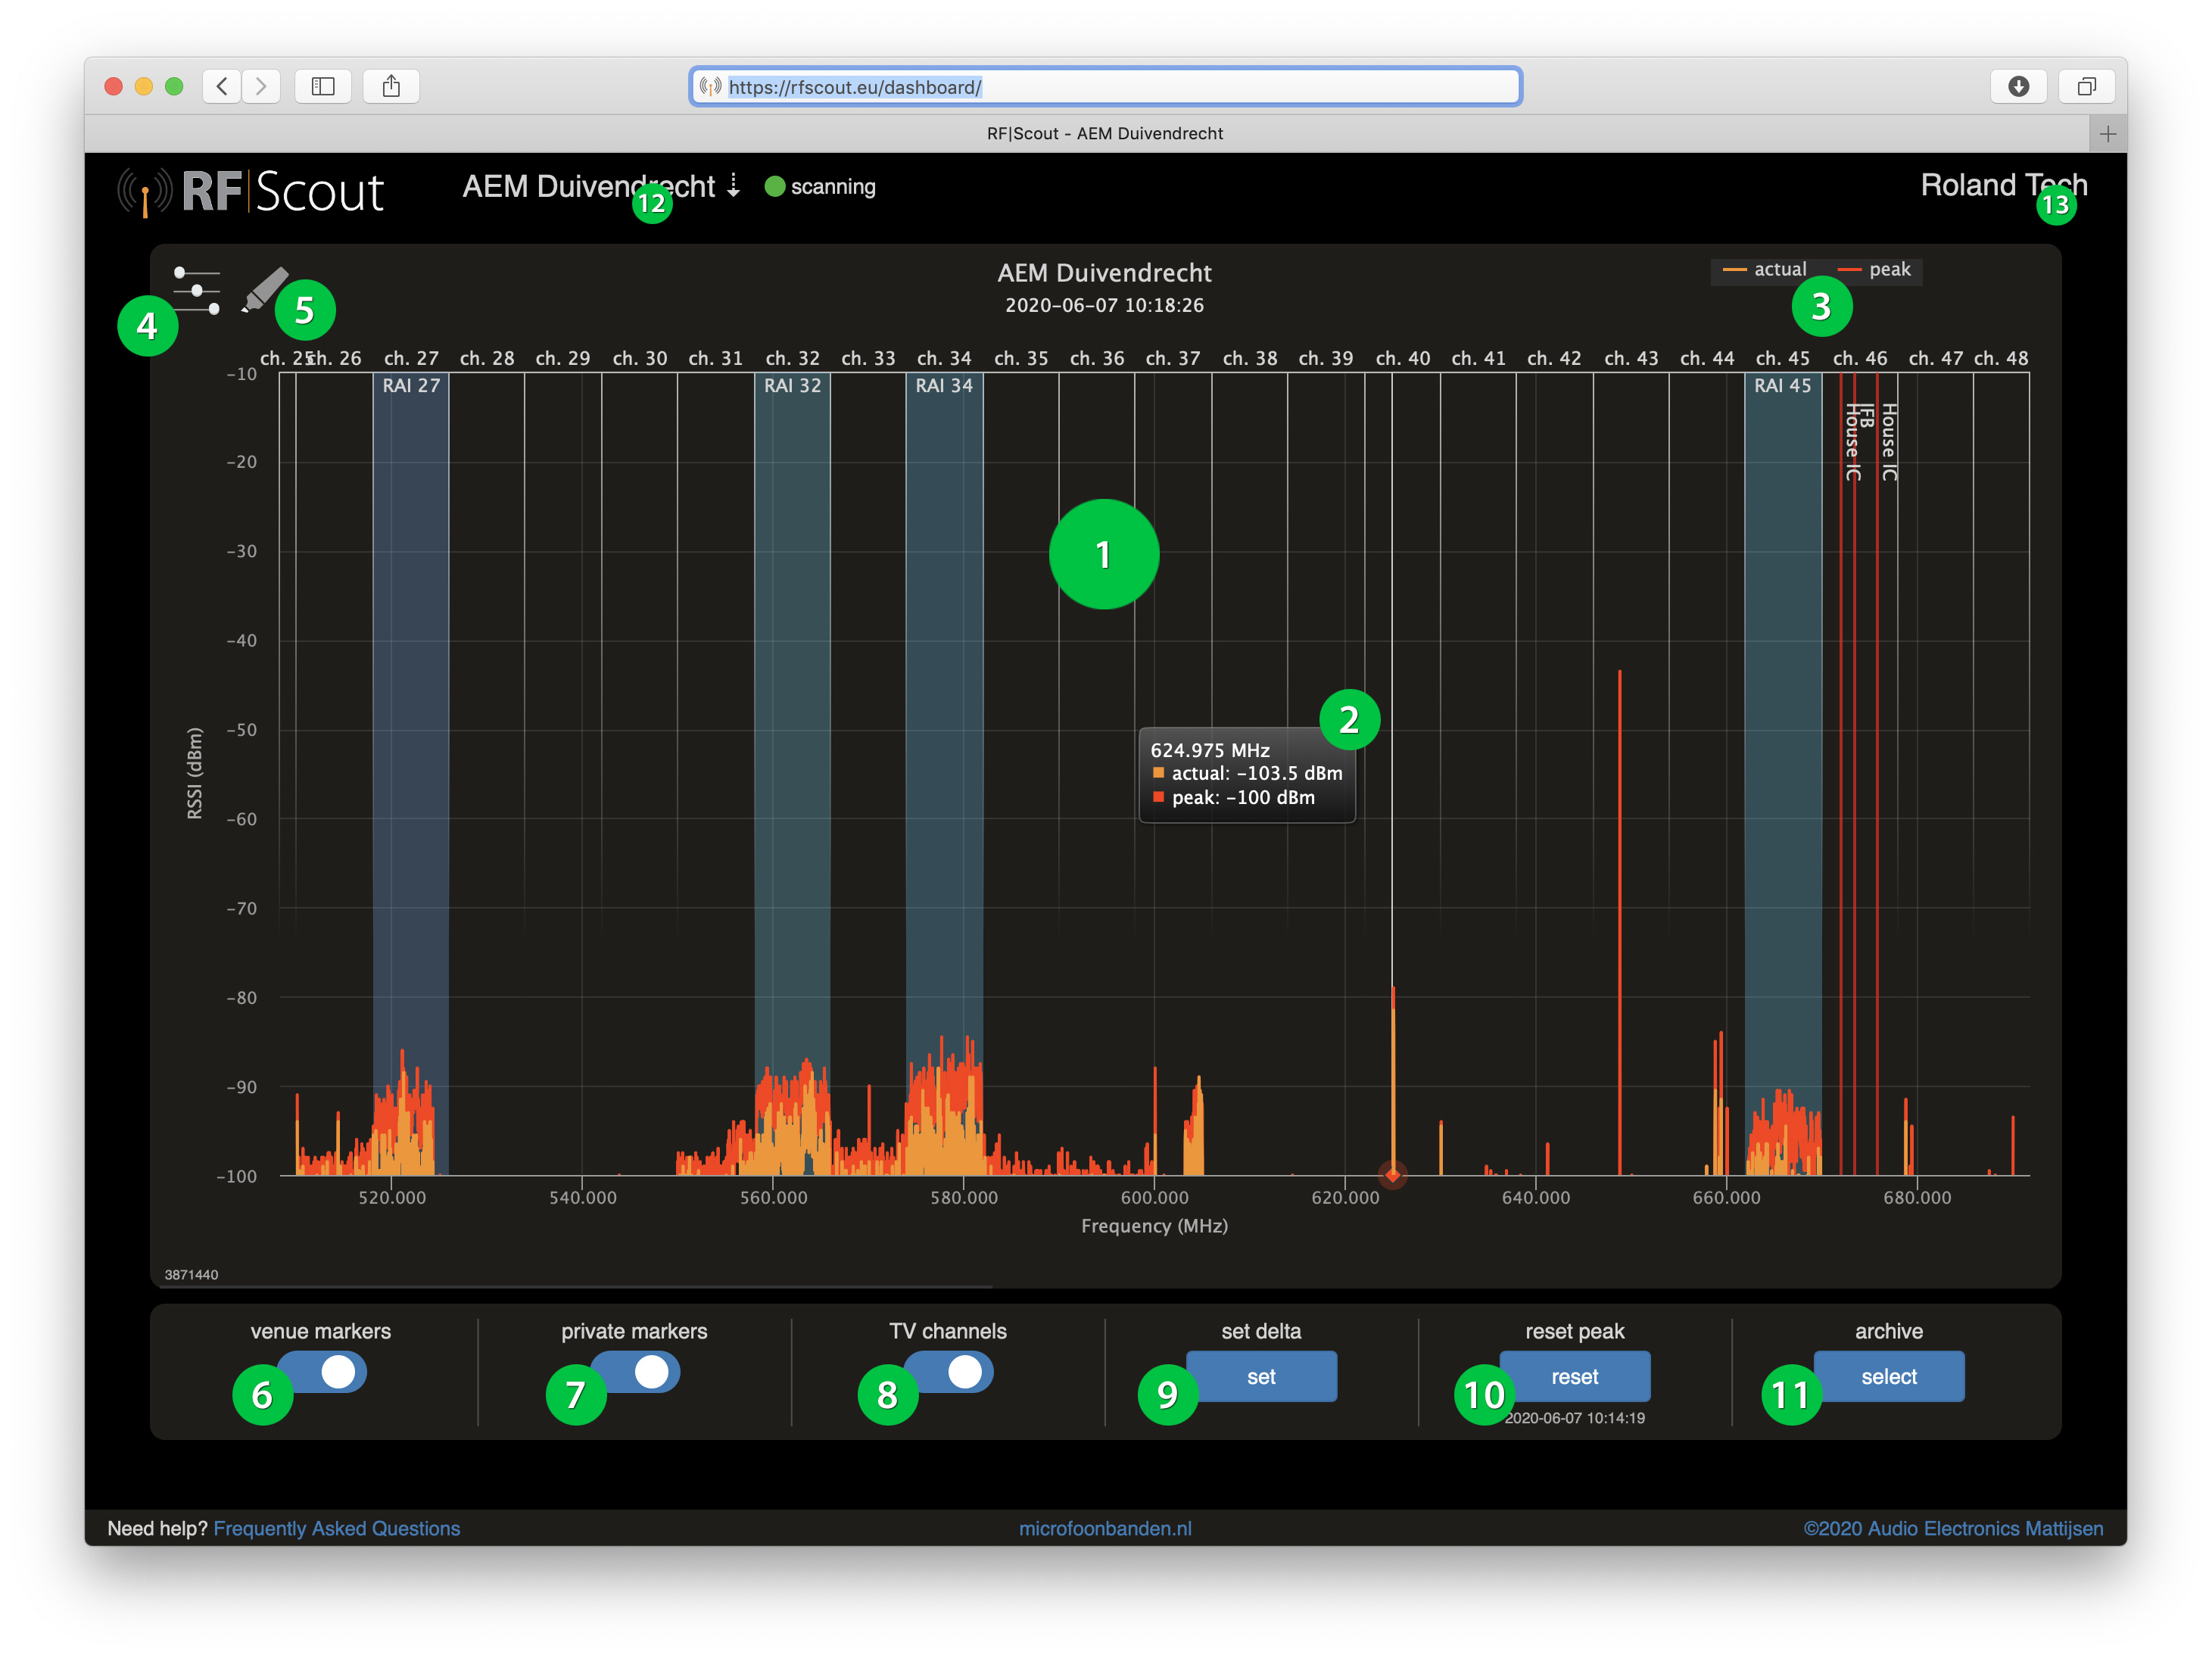
The Main graphic shows the measured frequencies and their amplitude, lowest frequencies to the left, highest to the right. You'll see your own transmitters, someone else's transmitters, local interference sources and regional interference sources like DVB-T. Markers (see #5) will help you to tag known signals in order to help you "read" the spectrum even quicker.
The "Pointer" on the screen shows the exact frequency, the accompanying actual level of that frequency, the Peak level (if on), as well as the Archive value. You can thus see all relevant values at the same time and compare!
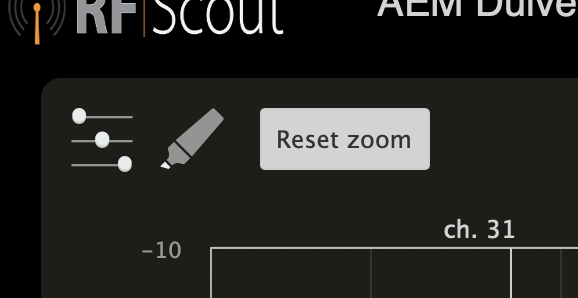
Navigate:
You can Zoom-In on the spectrum by simple pinch (on a touch device), and then swipe to scroll through the spectrum. With the Reset button top-left you can instantly return to the full spectrum scan as set in the Settings (see #4)
With a Mouse use [Click&hold, Drag] to zoom, and there is another key combination together with the mouse to scroll, but I keep forgetting which combi that is.
The graph can show multiple kinds of "scans" or "traces". In the top-right corner Legend you can click the various traces on/off. For the Delta Trace (see #9) you need to have set a reference trace first, for an Archive (see #11) a historical trace needs to be selected first.
Traces:
Actual (orange): the current "real-time" spectum scan (also known as "trace").
Peak (red): the highest measured value of all scans, since the last Peak Reset or innitial start of the application
Delta (blue): the difference between the current real-time scan and a scan of an earlier moment in time. See #9: Delta Trace.
Archive (magenta): you can go back up to 6 months in time and get spectral information of earlier scans. You can go to any individual scan of the last 24 hours. After 1 day scans are averaged to a minute, after 2 days these are again averaged to an hourly agerage.
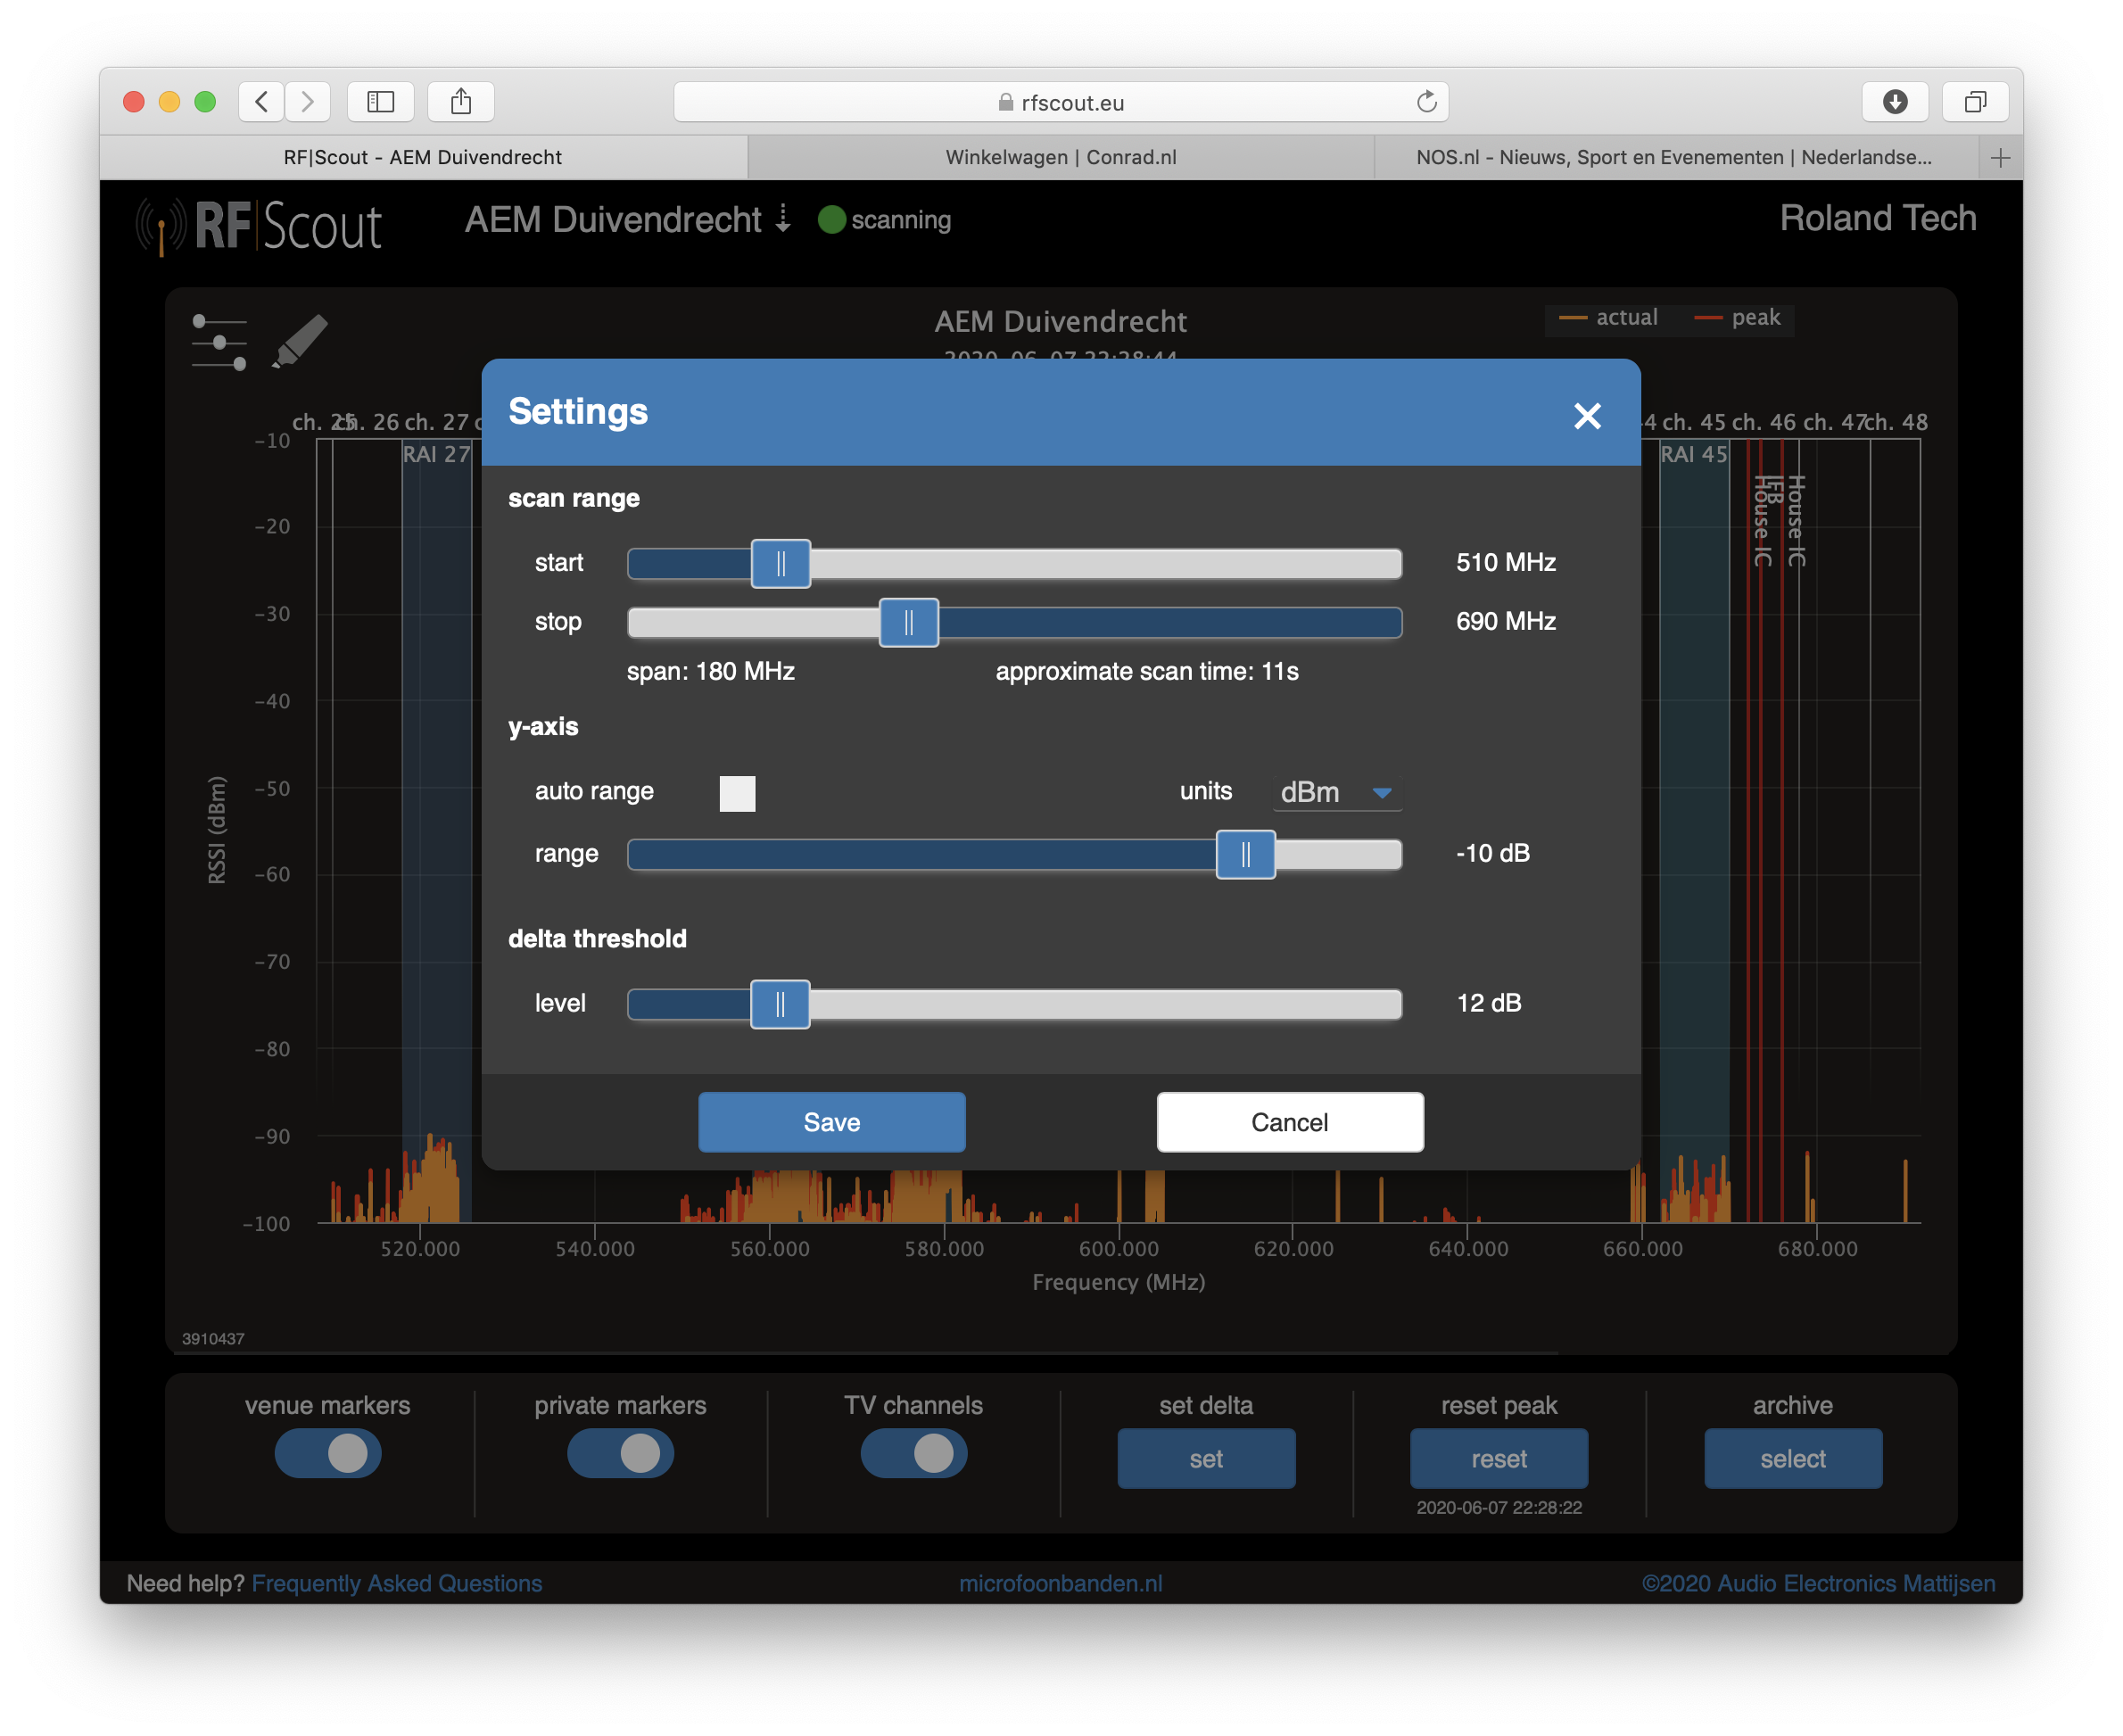
Here you set the general start and stop frequency of the required scan (note 1*), anywhere from 150MHz to 2700 MHz, with a max of 1500 MHz. The bigger the scan (known as the "span") the longer it takes. A general starting point is 470-700 MHz, which covers the main UHF and gives a nice refreshrate. The refreshrate is roughly indicated in seconds below the sliders(note 2*).
At Y-Axis you can set your Units: dBm or dBμV, and if you want to Autoscale or make the scale fixed.
The Delta Treshold sets how much the new scanned-value needs to be different from the reference scan in order to start indicating the difference. This helps in eliminating irrelevant little indications and make sure your attention is grabbed if there are serious thinks happening. Also see #9
*Note1 that in order to Zoom in and out, do not set new frequencies here :-) Rather use the Zoom function (see #2:navigate). Changing the Fstart and Fstop here sends new instructions to the RF|Scout, which will have set itself up and make a complete fresh new scan. This may take some time (typ 30 sec-2 min). The Zoom in/out does not change the span, so you actually just zoom in and out on the acquired data, and its all instant while RF|Scout happily aquires the whole span in te background
*Note2: Resolution of the RF|Scout is always 25kHz steps, regardless of the scan size. You always have that high resolution, even in a 1500 MHz span. It just takes a bit longer :-)
*Note 3: A couple of interesting area's: the VHF goes up to 300MHz, then 470-608 (US) or up to -694 (EU) MHz is the most important area for your wireless mics, IEM's, IFB's and DVBT. 736-754 MHz is the european intergap for 5G, 823-832 MHz is the intergap for 4G. The list can go on and on and on..... its always good to acquire some local situational awareness and set up RF|Scout accordingly.
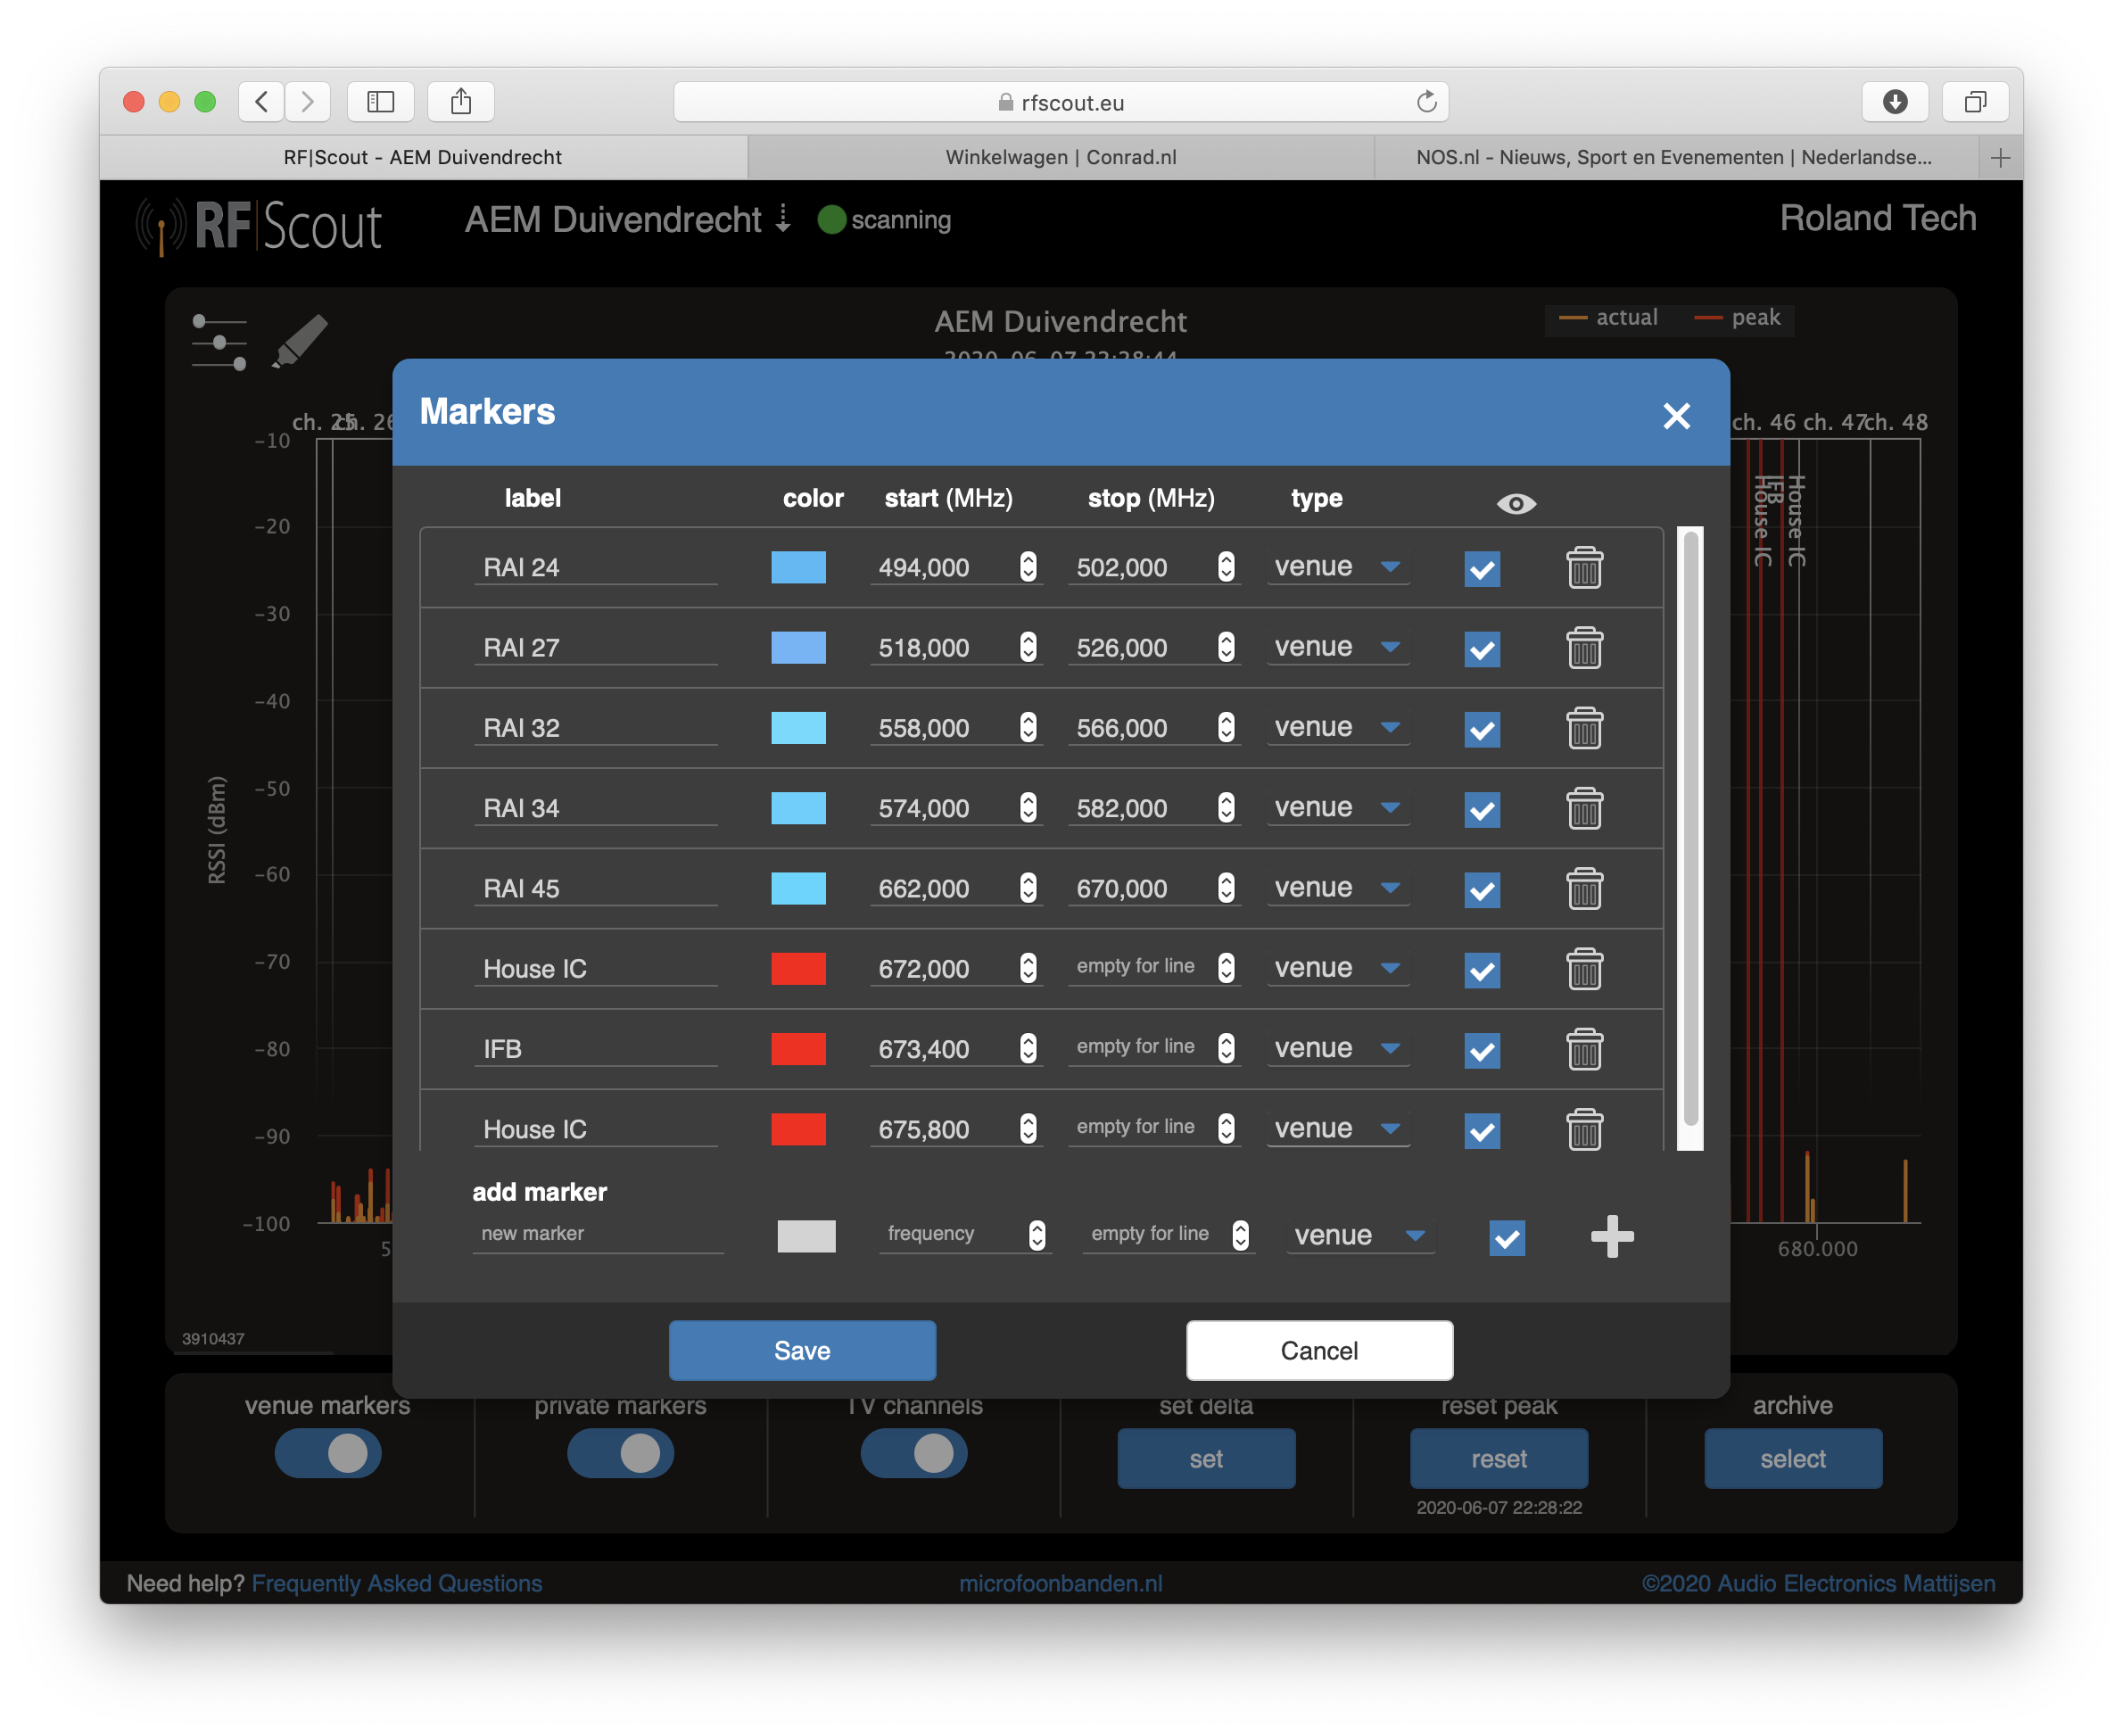
Markers assist in tagging known frequencies in order to "read" the spectum quick and easy. At the bottom of the screen you can quckly turn markers on/off, and behind this button top-left you can create and manage all markers. Markers are create as a "spot frequency" (only type in the "start" frequency in Megahertz) for say a wireless mic, or as an Area (also fill the "end" frequency) for say a Digital TV channel. Group markers with the same, or differentiate each with their own color. Finally designate each marker as Venue marker or Private marker:
Venue Markers are markers that belong to that specific RF|Scout node on that location. every user can turn them on/off individually (see #6). Typical use are resident wireless and know sources of interference in that location.
Private Markers are the users own, regardless on which RF|Scout you are logged in. Other users have their own Private Markers. Typical use are your own systems, or frequencies that you (and mainly you) have your special interest.
Venue Markers are markers that belong to that specific RF|Scout node on that location. every user can turn them on/off individually. Typical use are the "house" wireless mic, intercom and/or systems for the hearing impaired, know sources of interference in that location like Digital TV transmitters, the local reportermic, or a LED wall, etc. Stuff thats regularly there, and everybody should take into account whenever he drops by at your place.
Private Markers are the users own markers, regardeless on which RF|Scout you are working. Typical use are your own wireless systems or other specific frequencies or frequency-bands your are interested in.
MHz or TV Channel? Both terms are used all the time to talk about frequencies, so at the bottom of the graph we always have the Universal Mega Herz's. However, with the [TV Channel] switch on the bottom you can instantly see in which TV-band* you are operating. Like all markers each user can individually turn these on/off.
*currently based on the PAL TV channel system of 8 MHz (pretty much worldwide etc). We think it might be a good idea to make this an option to switch to the 6MHz NTSC system in the Settings menu.
TV Channels PAL vs NTSC

Tip: Little tricky thing here if you aren't aware: The "TV channel" thing is based on analogue television transmission. the PAL and SECAM systems are 8 MHz wide, whereas the NTSC system (North America plus half of South America) is based on 6 MHz wide channels. As you can see in the list above, it gets interesting if a guy from LA talks to a guy in Berlin about "I have my wireless in TV channel 24". They could be talking 36MHz of difference without realising it (!). You are lucky in TV Channel 42 however, which of course is the universal answer anyway.
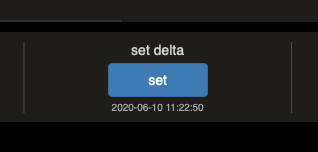
The Delta Trace returns the difference between a Realtime scan and a selected "reference" scan. The latter is set by the [Set Delta] button, below which it will show the exact date and time of the reference scan.
Sounds like a simple feature, but actually its quite powerfull! A straight blue line? Then all-is-well and as expected. Any deviation (a transmitter that should have been there but isn't, or the other way around a transmitter that you didn't see coming, but suddenly is there) jumps directly at you: a blue peak upwards = an source appeared unexpectedly. A blue "drop"? You've lost a frequency you were expecting but its not there now
Combined with Markers you have a most powerfull set to monitor complex and ever changing situations
tip: you can quikcly turn traces on/off bij clicking on them in the legend top right.
tip: ENG crews are seriously easy to recognise when they walk in with the Delta trace.
tip: the minimal required difference to start showing in the Delta trace can be set in Settings. This declutters reading.
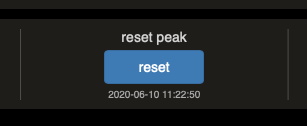
This basically does pretty much what it says: it resets the recorded peak value for every frequency. The time of the last reset is shown under the button. Tip: as with any trace: you can turn displaying the Peak value's on/off by clicking in the legend top-right
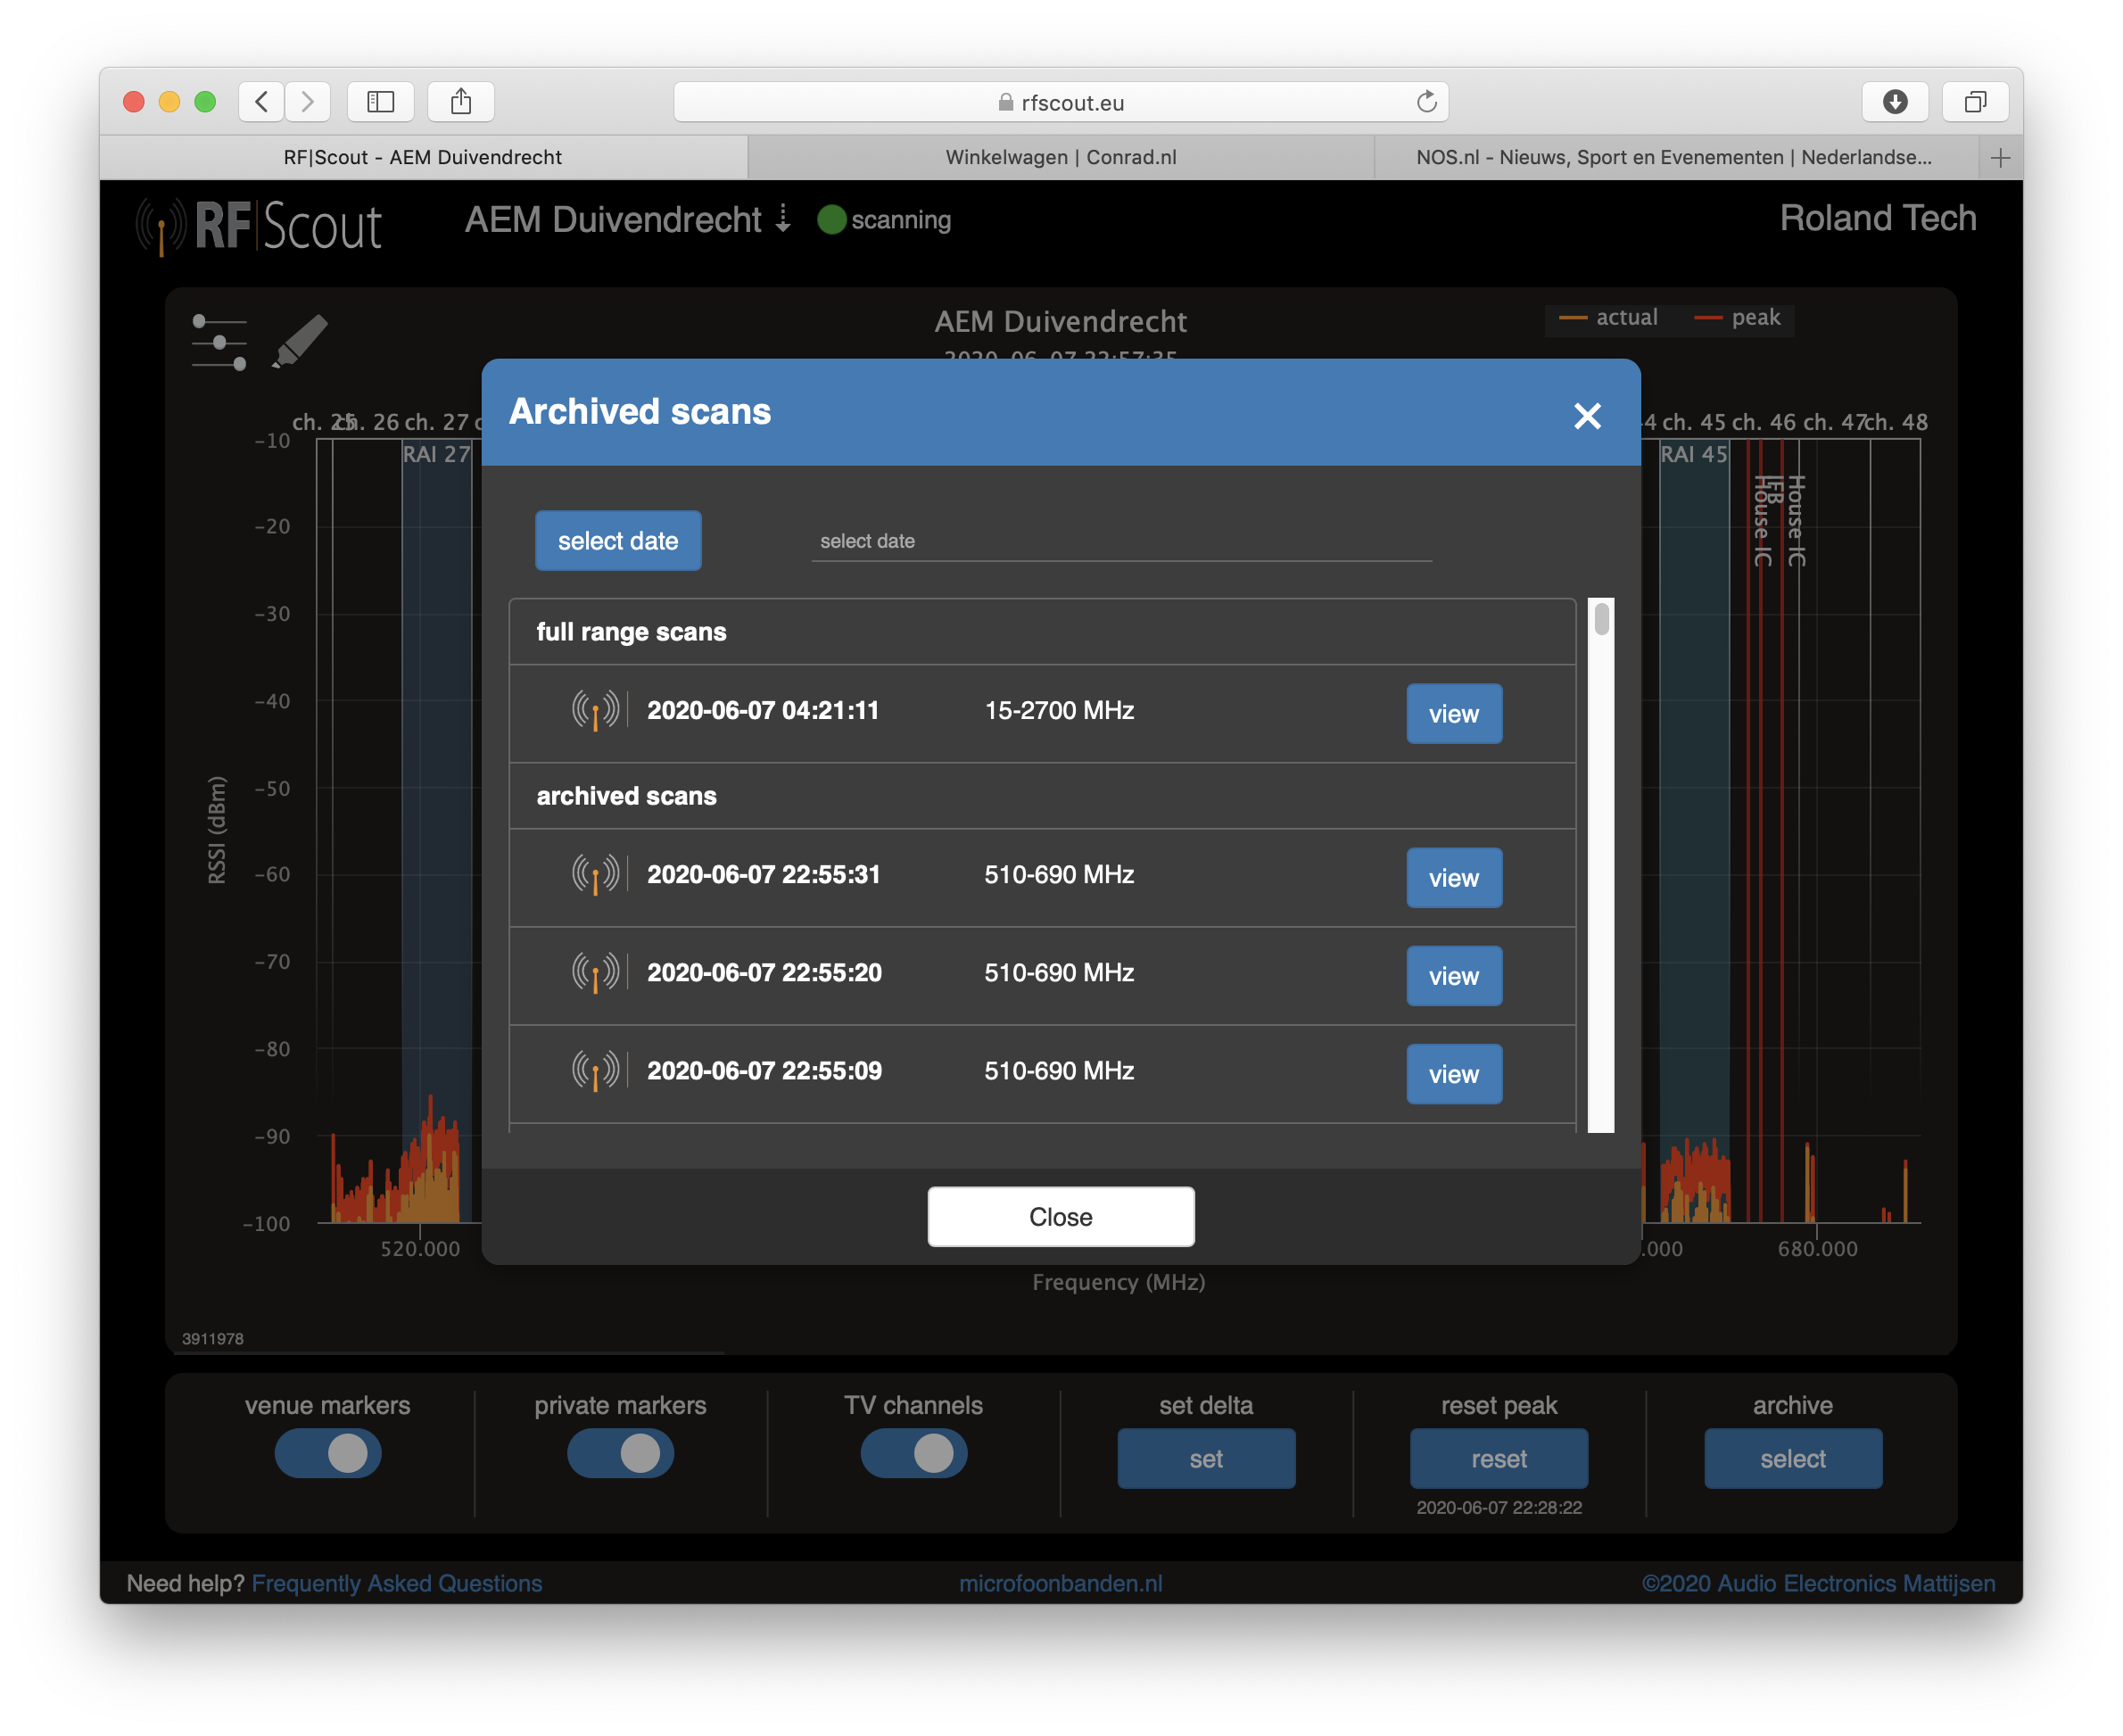
Archive (magento strace). You can browse up to 6 months back in time. The first 24 hours all individual scans are available. After 1 day RF|Scout averages on a per-minute basis, and after two days these are averaged out to hourly averages.
Full-Range Scans
At certain intervals RF|Scout automatically makes a Full Spectrum scan. This alays occurs somewhere betwoon 03:00 and 04:00 AM. This full spectrum scan is available to get an idea how the spectrum at that venue looks like "in rest". The "Full-Range" scan is merely an indication: the resolutie is marginally less @ 50kHz intervals (ipv 25) and practically speaking there is no (normal) antenna that is accurate from 15MHz to 2700 MHz. Keep it in mind when you interpret the full spectrum scan, but it is a nice bonus feature for your situational awareness.
RF|Scout is a multi-user, multi-node application. If you have (receivd) access to multiple Nodes you can choose which Node you want to look at here. As you can open multiple windows, each with a different Node, you can create your own Multi-View Central Command Spectrum Montoring bridge.
Behind the name of the Node you'll find its Offline/Scanning status.

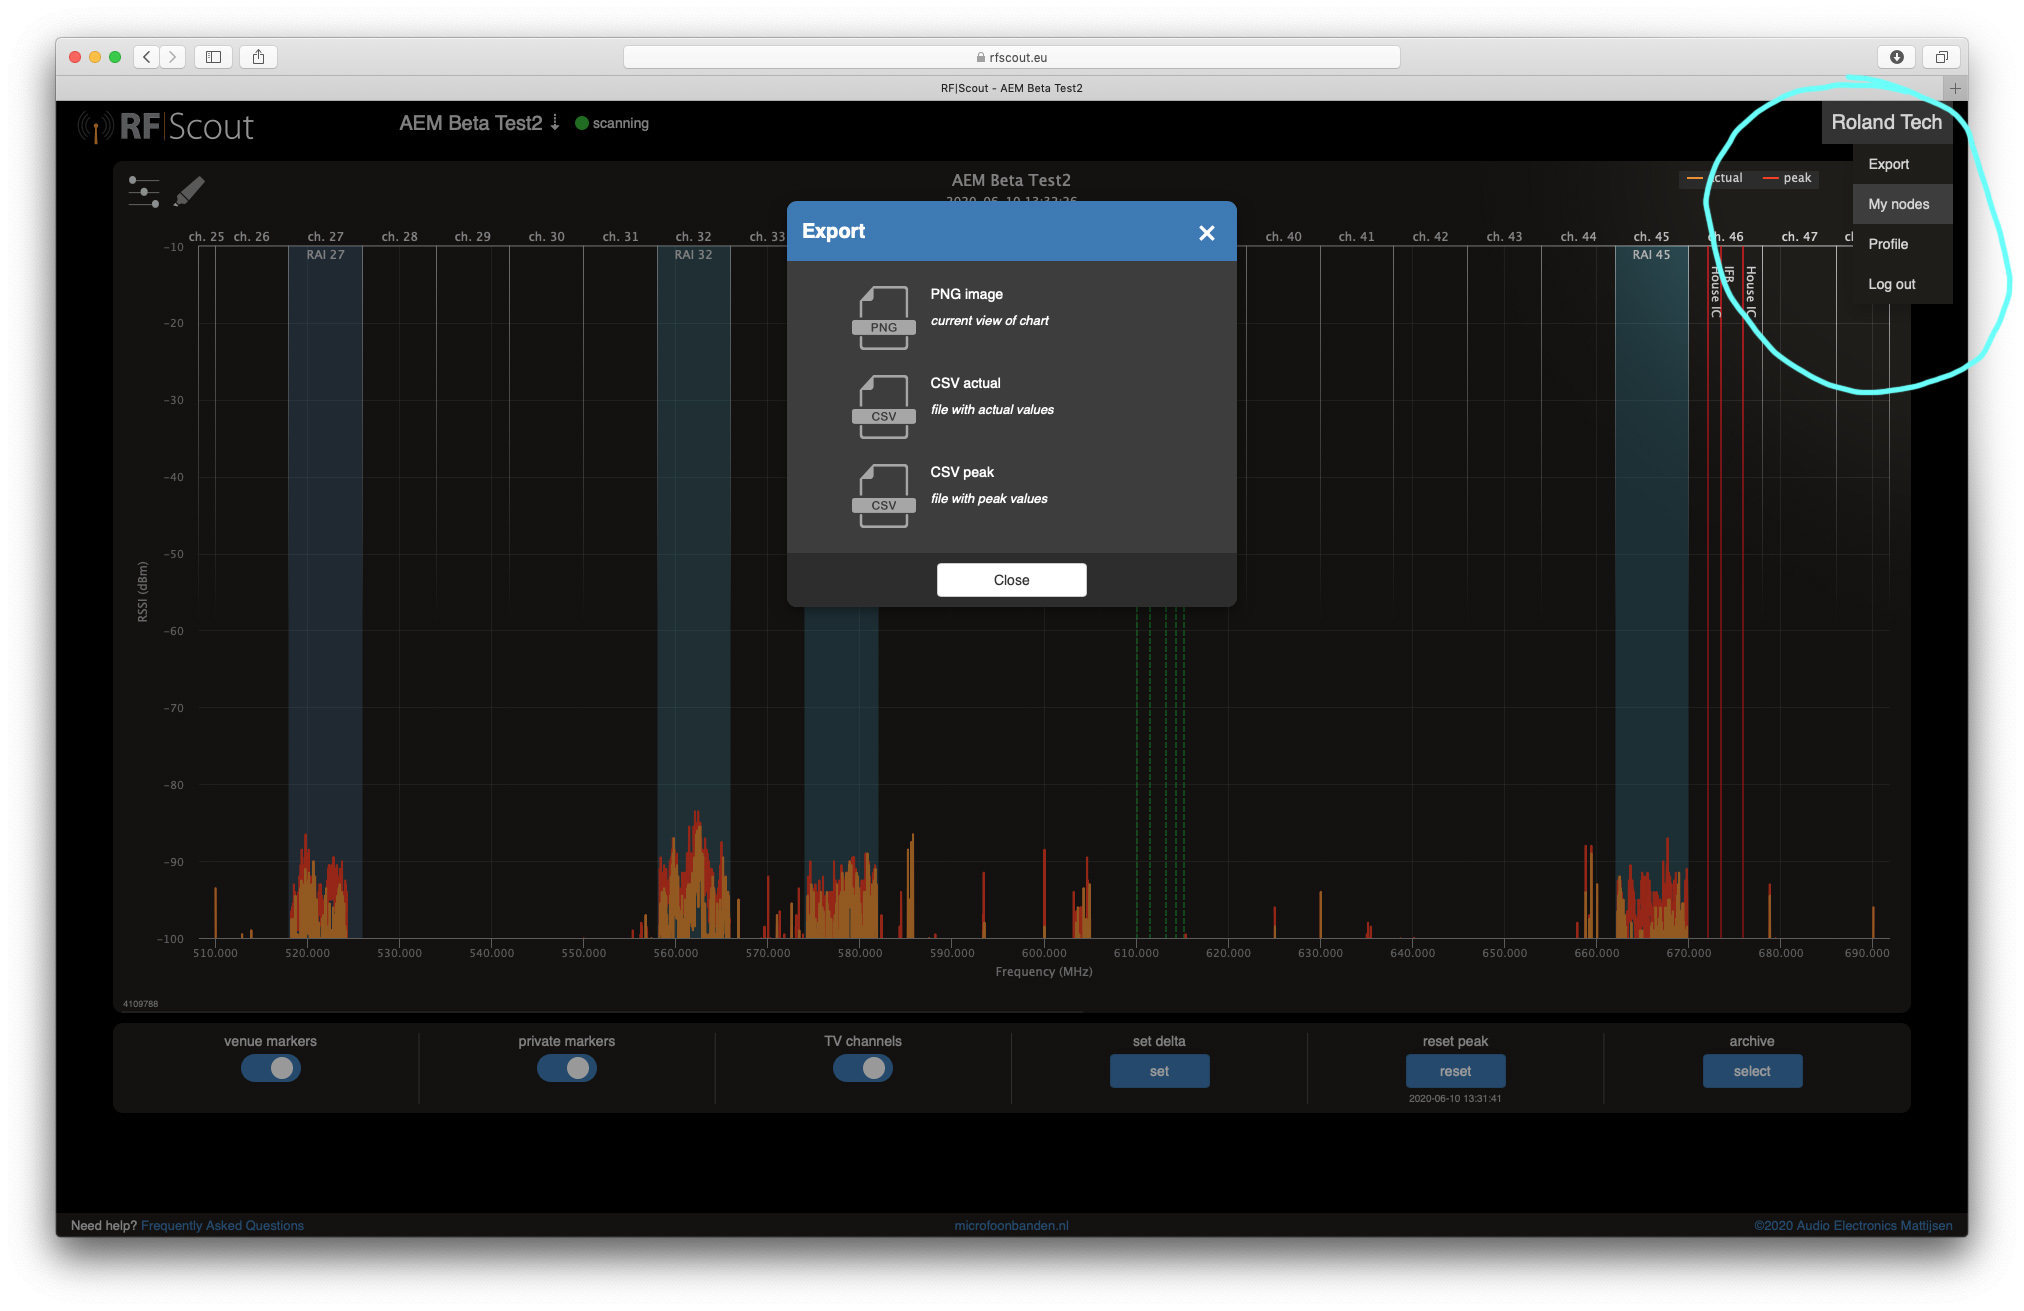
Click on the User name top-right and you find a short menu for stuff like making exports, details of the Nodes you have access to, and from where you can send Hotlinks, your own profile and a Log Out button.
Exports
At this moment RF|Scout supports exports as PNG graphic, CSV realtime data or CSV -Peak data. Through exports you can bring in reallife data into applications like Shure Wireless Workbench*, so you can make a frequency coordination plan for your whole system based on your equipment and preferences.
* Sennheiser WSM, PWS IAS, Intermod Assistare all being tested as we speak
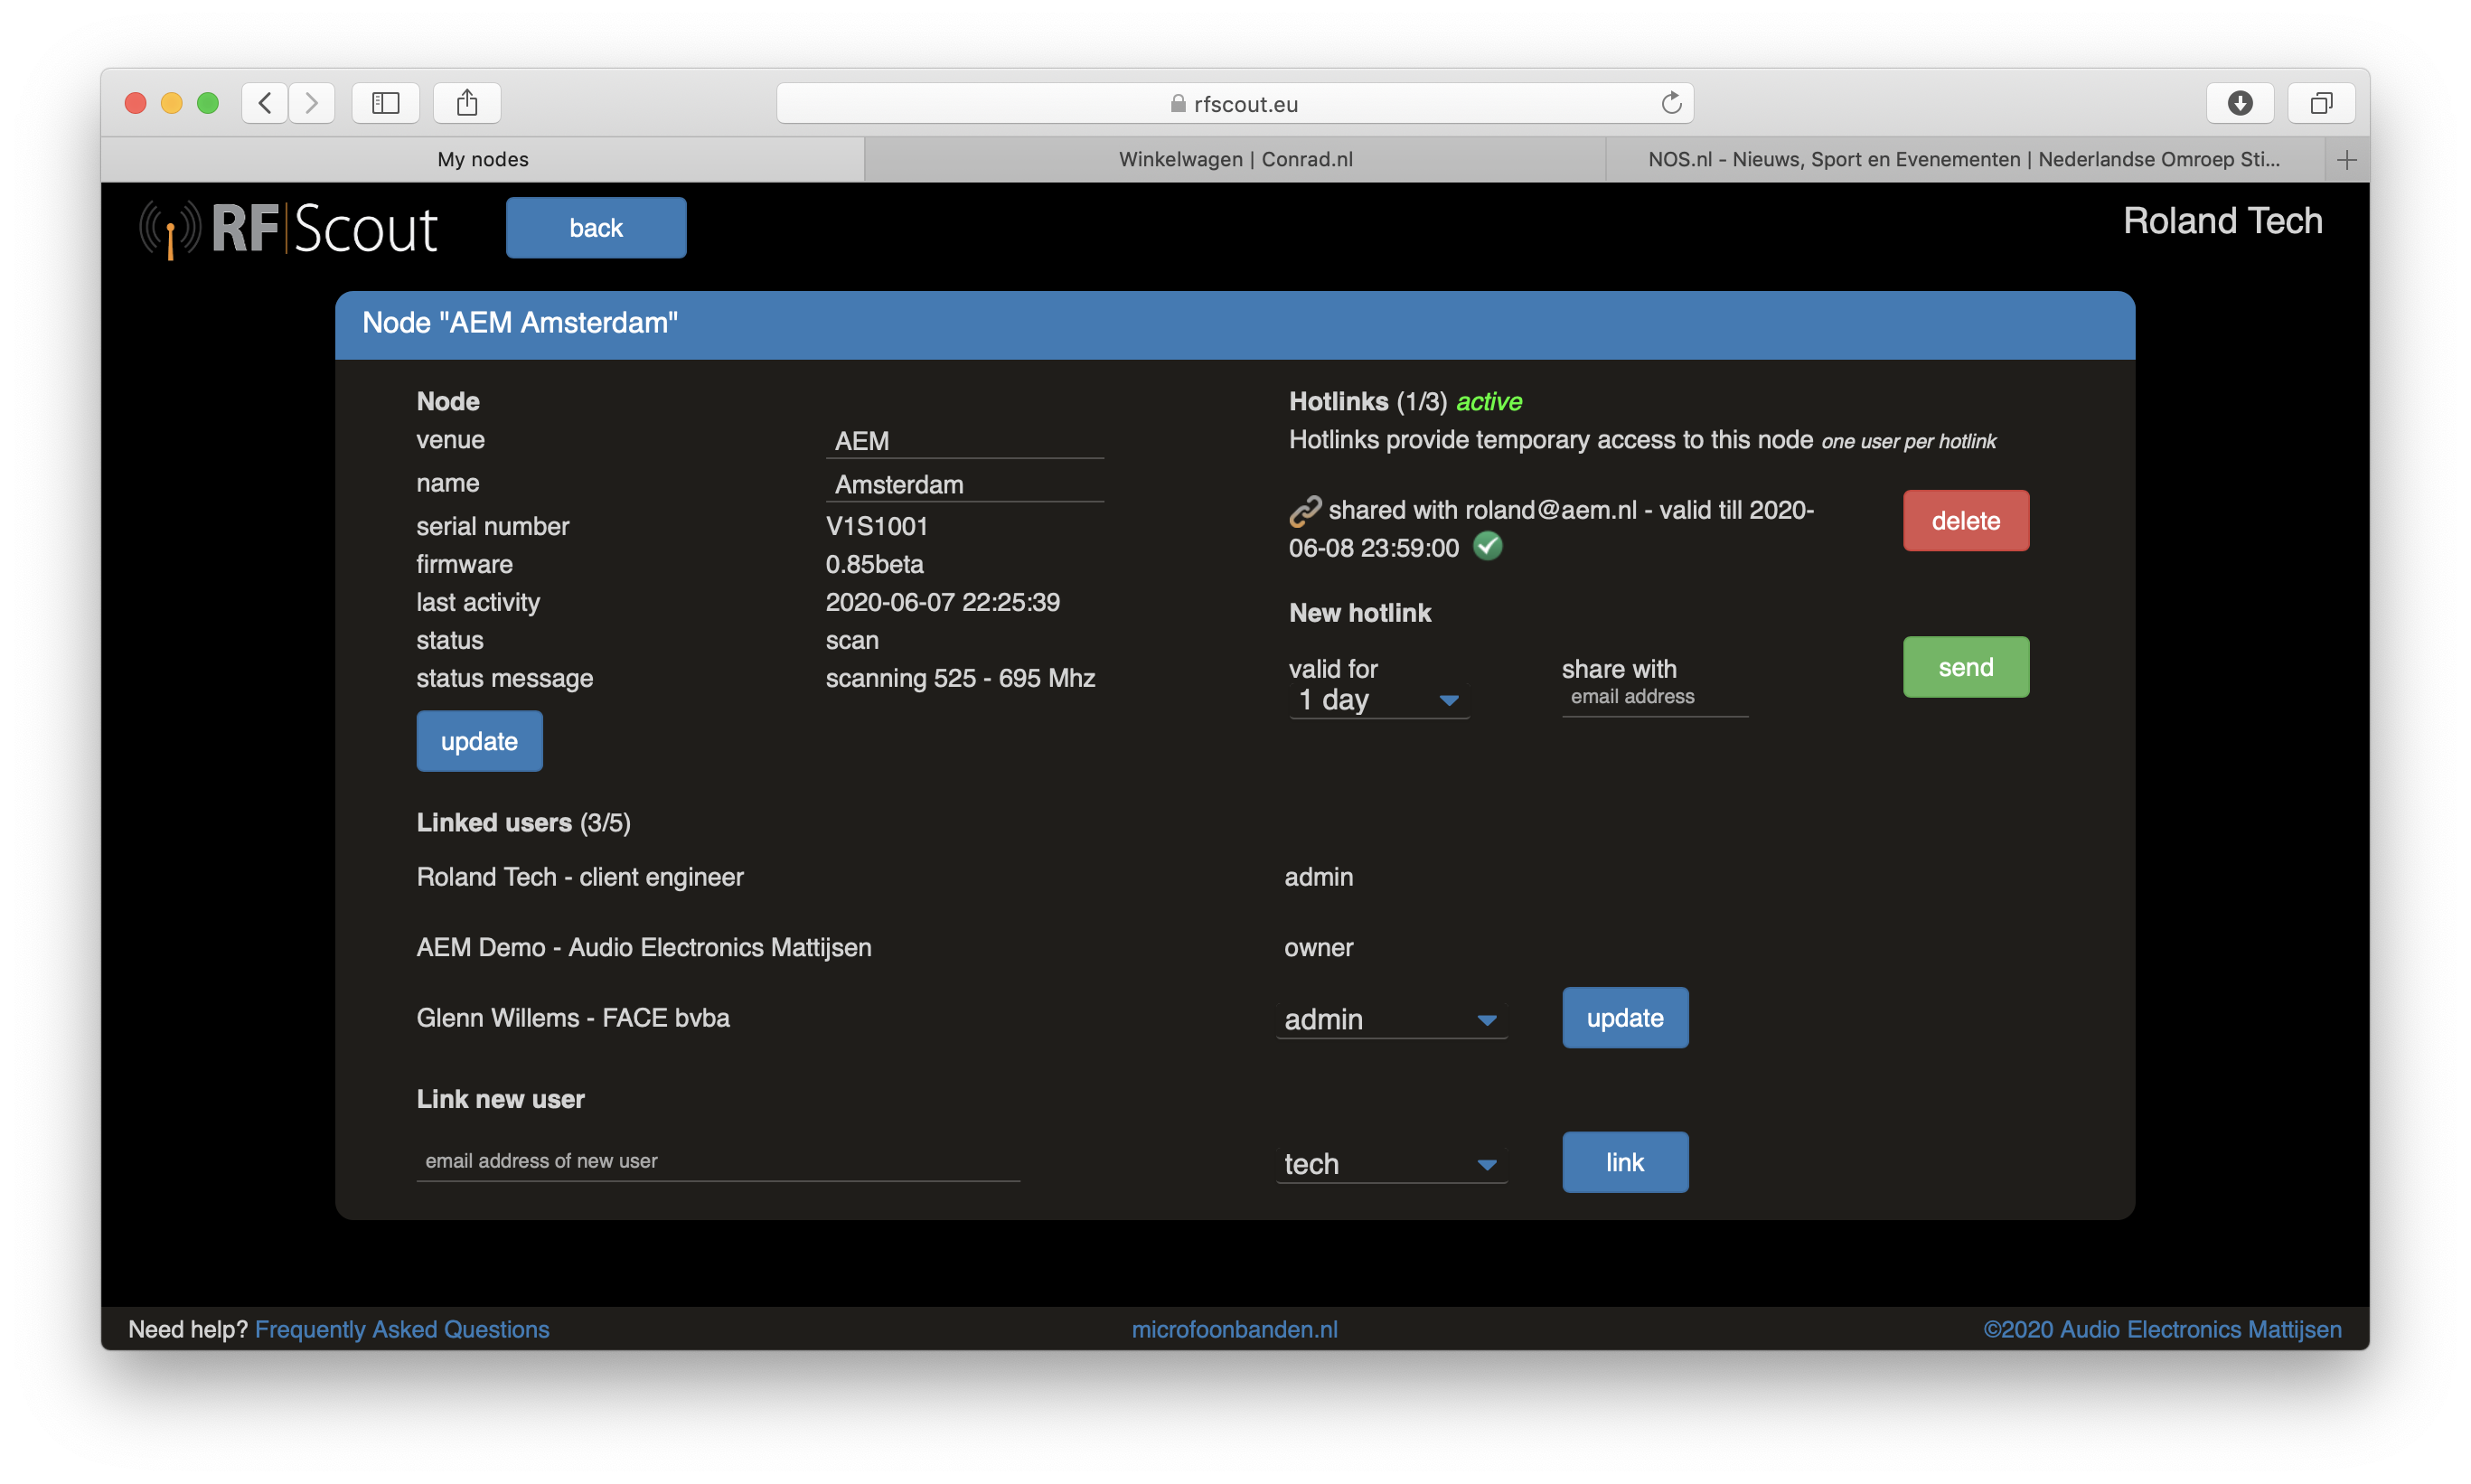
My nodes and HOTLINKS!
Under My Nodes you'll find more information on the nodes you have access to, including who are also registered as permanent user. If you have Admin rights, you can manage access for up to 5 permanent users, who will have access anytime, from anywhere in the world.
Hotlinks are temporary granted access links to that Node. Up to 3 Hotlinks can be handed out at any time, each for up to 7 days max. Think a guest engineer that will visit your venue in Tasmania next week but is currently touring in Canada. You send him a Hotlink, and he can look at your venue, get his real life info, make his plans at his convenience, and arrive relaxed and all set-up at your venue.
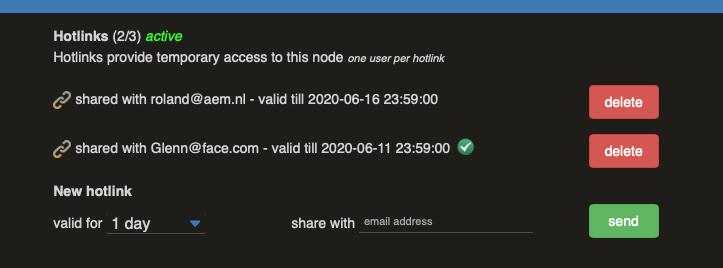
Just fill in his/her emailadress, select how lomng you want to grant access rights (max 7 days) en [SEND]. He/she will received an email like this: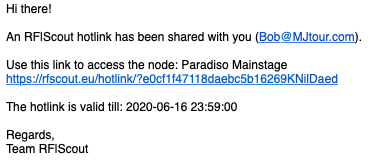
Disclaimer: RF|Scout is and remains in development. AEM reserves the right to change, improve, delete, extend or split-up any feature or aspect of RF|Scout, at any time and in any form. No claims can be made based on any desciption given on functionality or features of RF|Scout.